Various Mathematical Analysis Functions
uWater is the first to apply DDA, PDA, and advanced Advanced-PDA algorithms for simulating water supply networks.
| DDA | PDA | A-PDA | |
|---|---|---|---|
| Nodal Supply Flowrate | Demand Flow | Hydraulically dependent Flow | Flow dependent of water pressure and reservoir capacity |
| Nodal Water Pressure | ✕ | ○ | ○ |
| Water Source Capacity | ✕ | ✕ | ○ |
| Normal Situation Analysis | ○ | ○ | ○ |
| Water Pressure drop Abnormality | ✕ | ○ | ○ |
| Hydraulic Capacity Abnormality Analysis | ✕ | ✕ | ○ |
| Related S/W | US EPANET | WaterGEMS, etc. |
Water Distribution Network Simulation under Abnormalities
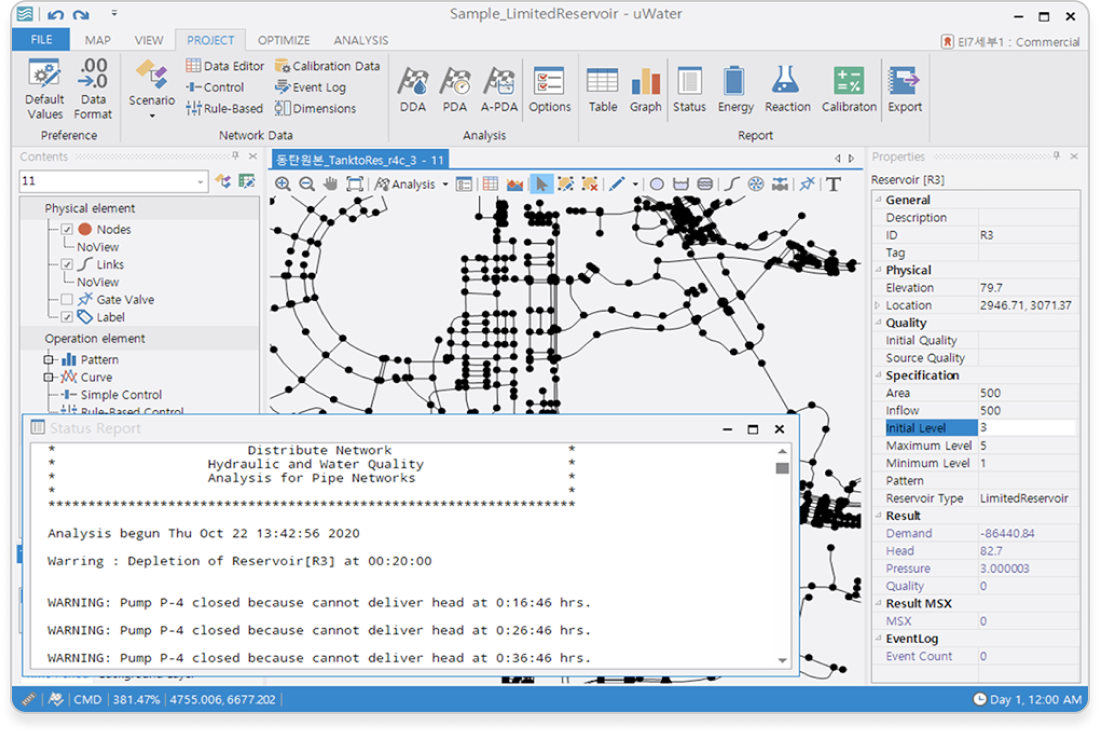
uWater's A-PDA algorithm enables effective simulation of various emergency situations that may cause water supply restrictions in real pipe network systems.
- Reservoir Failure: Implementation of water system conversion in case of emergency, calculation of available service time and amount of reservoir supply, etc.
- Singleness Pipe Failure: Calculation of flow rate and pressure change due to single pipe failure
- Isolation segment: estimating the extent of damage and supply of the isolated area
Water Quality Analysis of Water Distribution Network
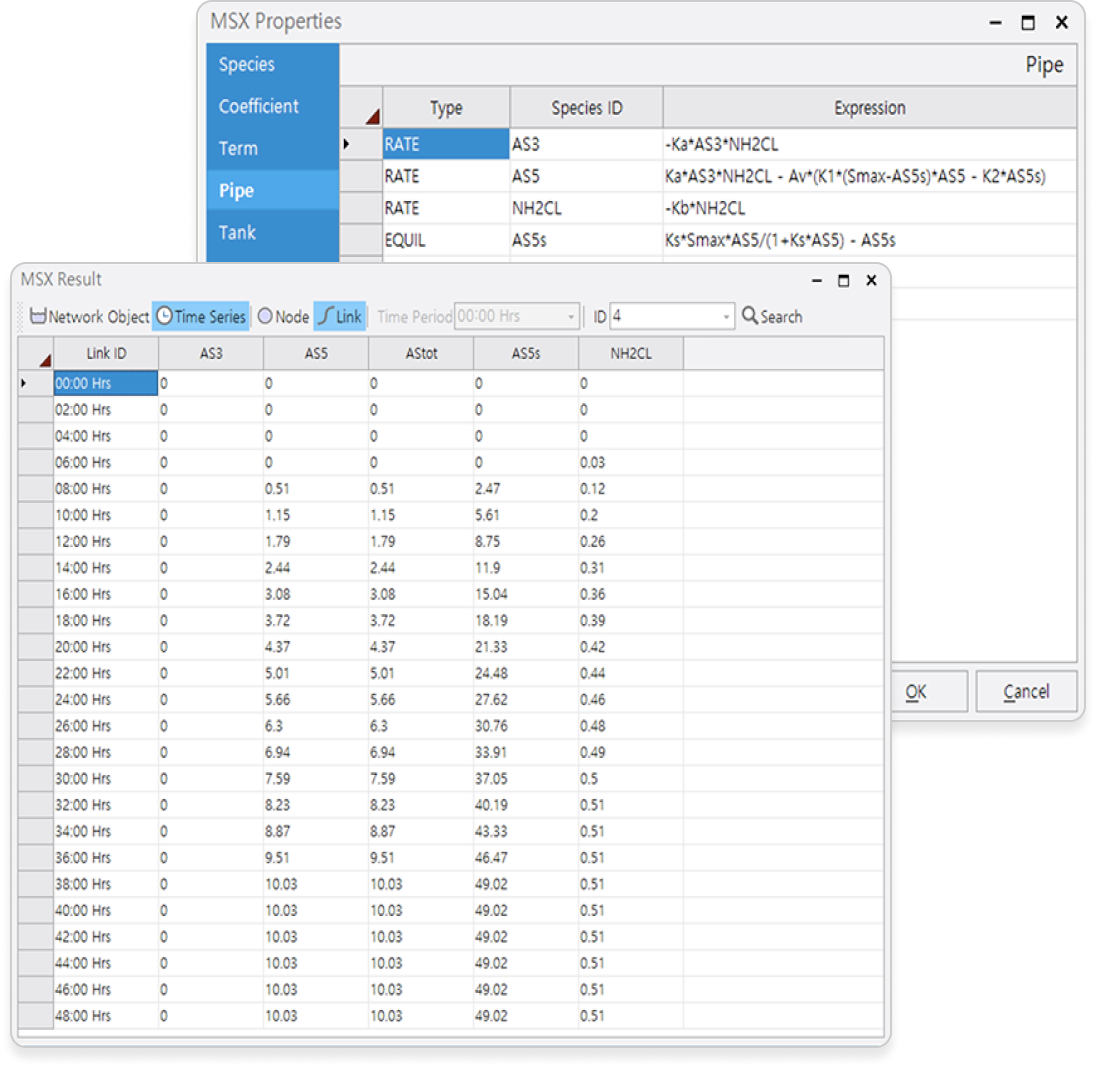
uWaterapplies Multi-Species Extension (MSX), which enables modeling of highly complex reactions between a variety of chemical and biological species, both in the flow and on the wall of a pipe in the water supply network. This allows you to analyze the behavior of water quality in the water supply network over time.
- Simulation of non-reactive tracer substance movement
- Analysis of the movement and reaction of reactants that increase (disinfection by-products) or decrease (residual chlorine) over time
- Calculation of the transit time of water in the water supply network
- Calculation of the ratio of water from each intake source when mixing in a pipe network in multiple intake sources setting
- Analysis of coagulant components as well as individual compounds or ionic reactions such as HOCl and OCl-
- Compounds that can adsorb or desorb on the surface of the pipe, such as particulate matter and organic matter, iron oxide, etc. adhering to the surface of the pipe wall
Water Distribution Network Adversarial Analysis
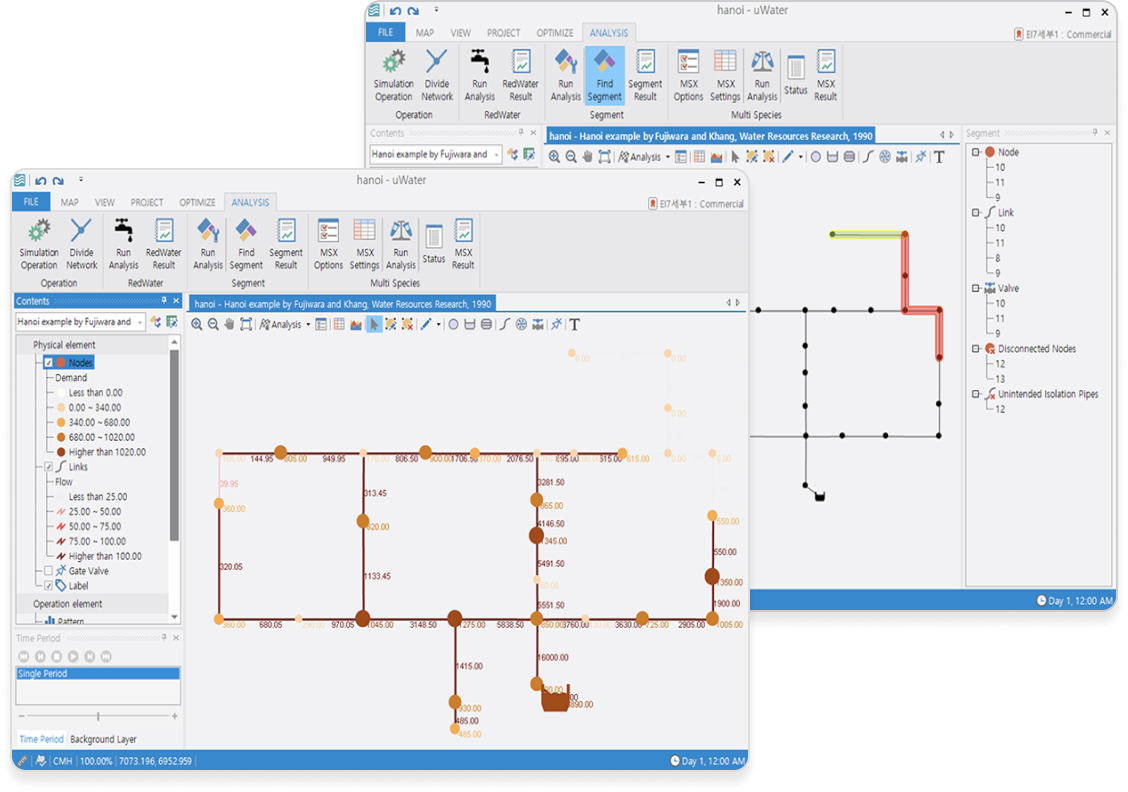
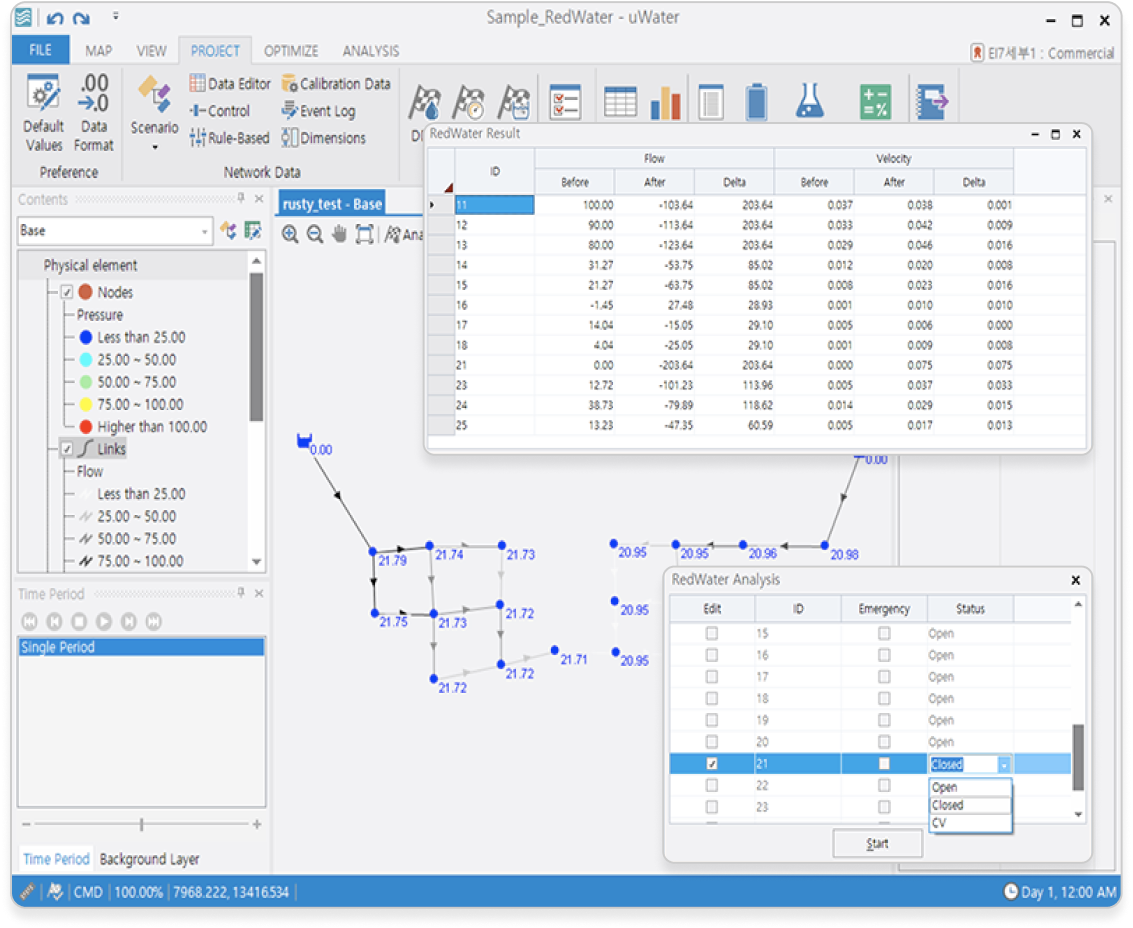
uWater analyzes conduits with a high probability of occurrence of red water due to changes in water flow direction during water system conversion or in case of emergency in the water supply network.
- Comparative analysis of the analysis result of the general condition and the flow direction change result due to opening and closing of the conduit or valve
- Analyze the list of conduits where the flow occurred at zero or the flow of water was changed
Design Support Tools for Engineers
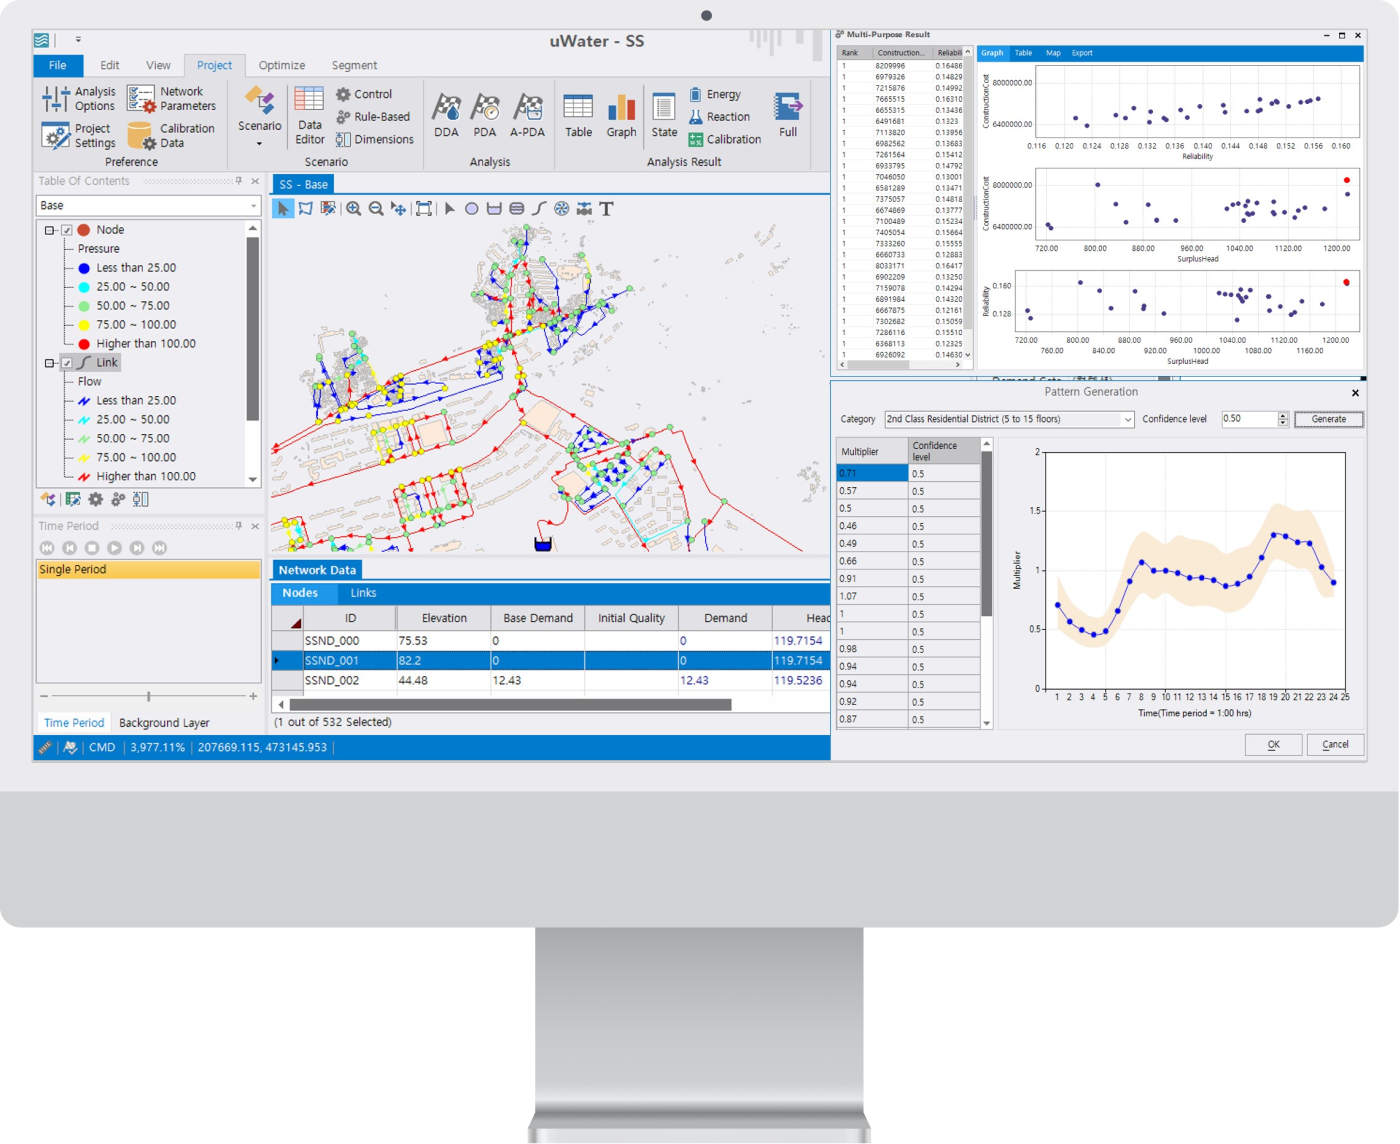
uWater can respond flexibly to various abnormal situations occurring in waterworks facilities and enables efficient and stable water distribution network operation.
- EPANET 2.0 data compatibility and improved data editing
- GIS background layer (ESRI Shape file) support
- Multiple scenario management simulations
- Optimal design support for water distribution network using elasticity index
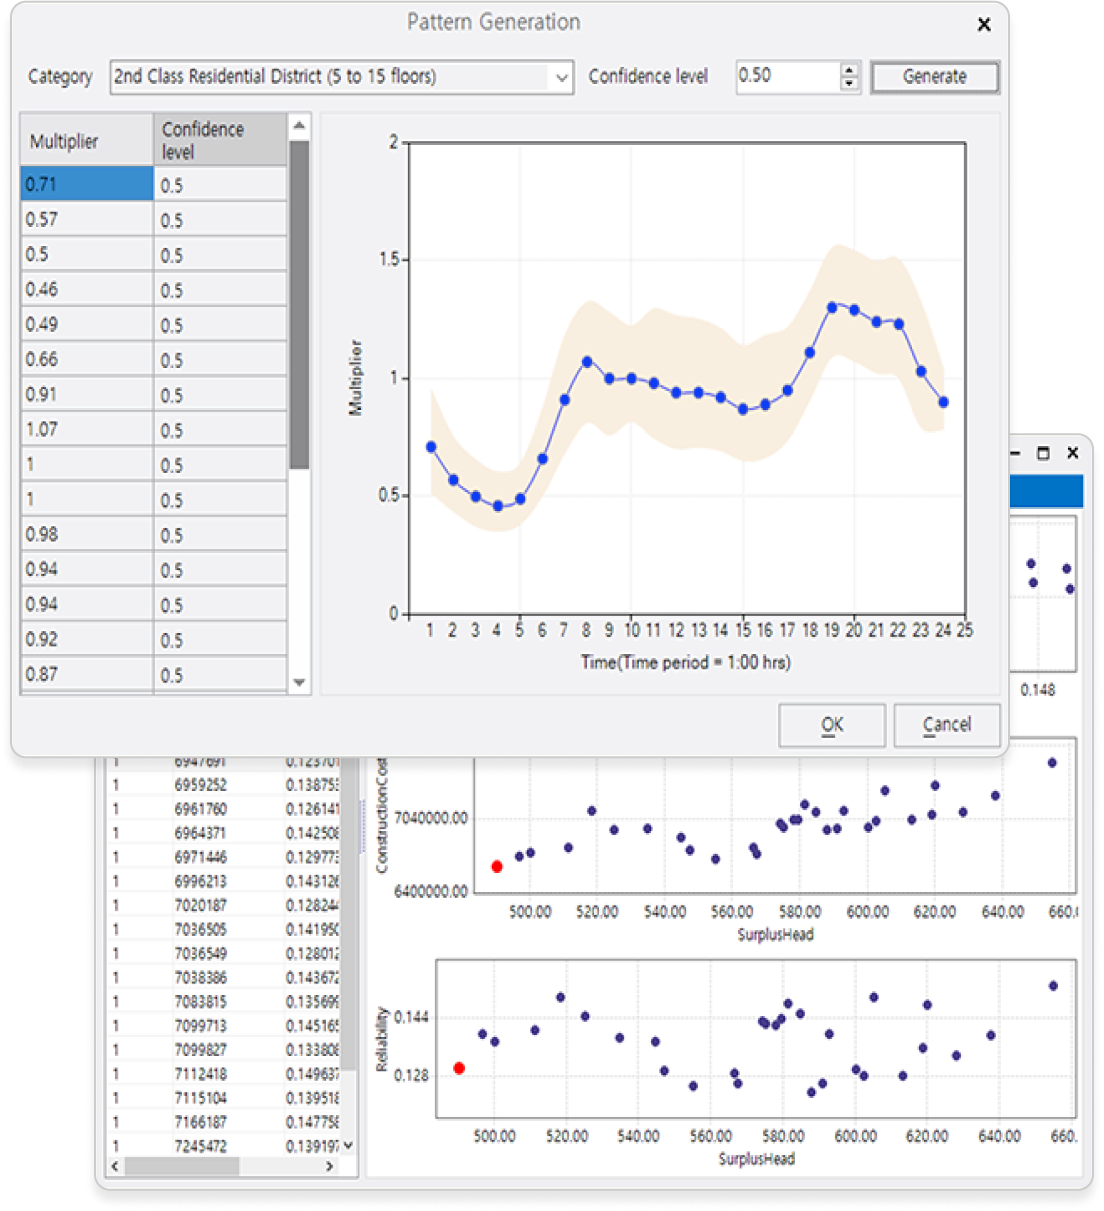
- Automatic creation of virtual water demand pattern input data reflecting regional characteristics
- Changing user patterns using the pattern editor
- Map editing function improvement and attribute information viewing and editing function
- Get started easily with various example files provided
- Support for the latest operating systems and online updates
- Menus and instructions are available in both English and Korean.
- Perform online water distribution network mathematical analysis in connection with SCADA system
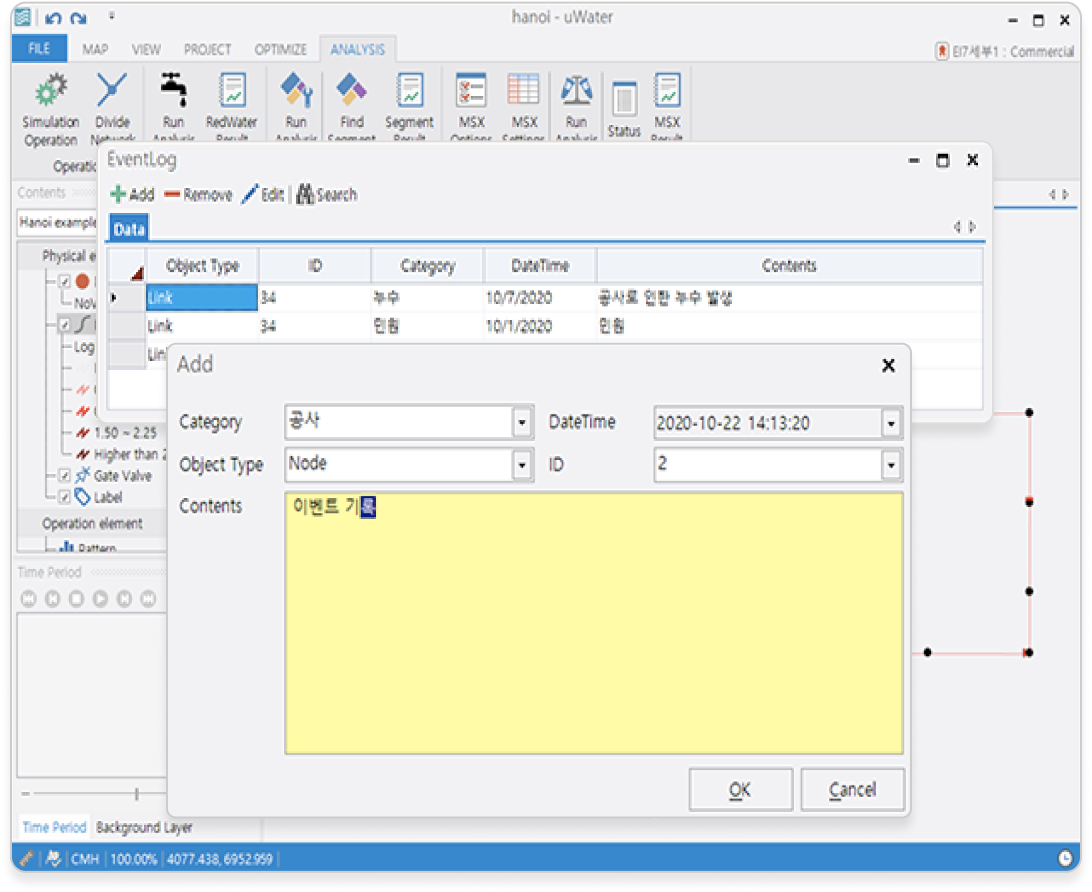
Event Management
Events such as accidents and construction can be recorded on the water distribution network object, and it can be rendered and expressed according to the number of times recorded on the data or map.
